Texas New Home Sales Fall for the Third Straight Month
HomesUSA.com reports inventory hits a new high, up over 13% year-over-year
DALLAS, Sept. 22, 2025 (GLOBE NEWSWIRE) -- New home sales in Texas declined for the third consecutive month in August, while active listings climbed to a record high, according to the latest Texas New Home Sales Report from HomesUSA.com and its founder and CEO, Ben Caballero, the nation’s top-ranked real estate agent.
Active listings reached their highest level recorded since HomesUSA.com began tracking the data in December 2017, reflecting a 13.3 percent year-over-year increase.
The HomesUSA.com New Home Sales Report uses Multiple Listing Service data – the most comprehensive, current, and accurate information – from the REALTOR® Associations of North Texas, Houston, Austin, and San Antonio. All averages are based on three-month rolling averages to capture seasonality and remove anomalies.
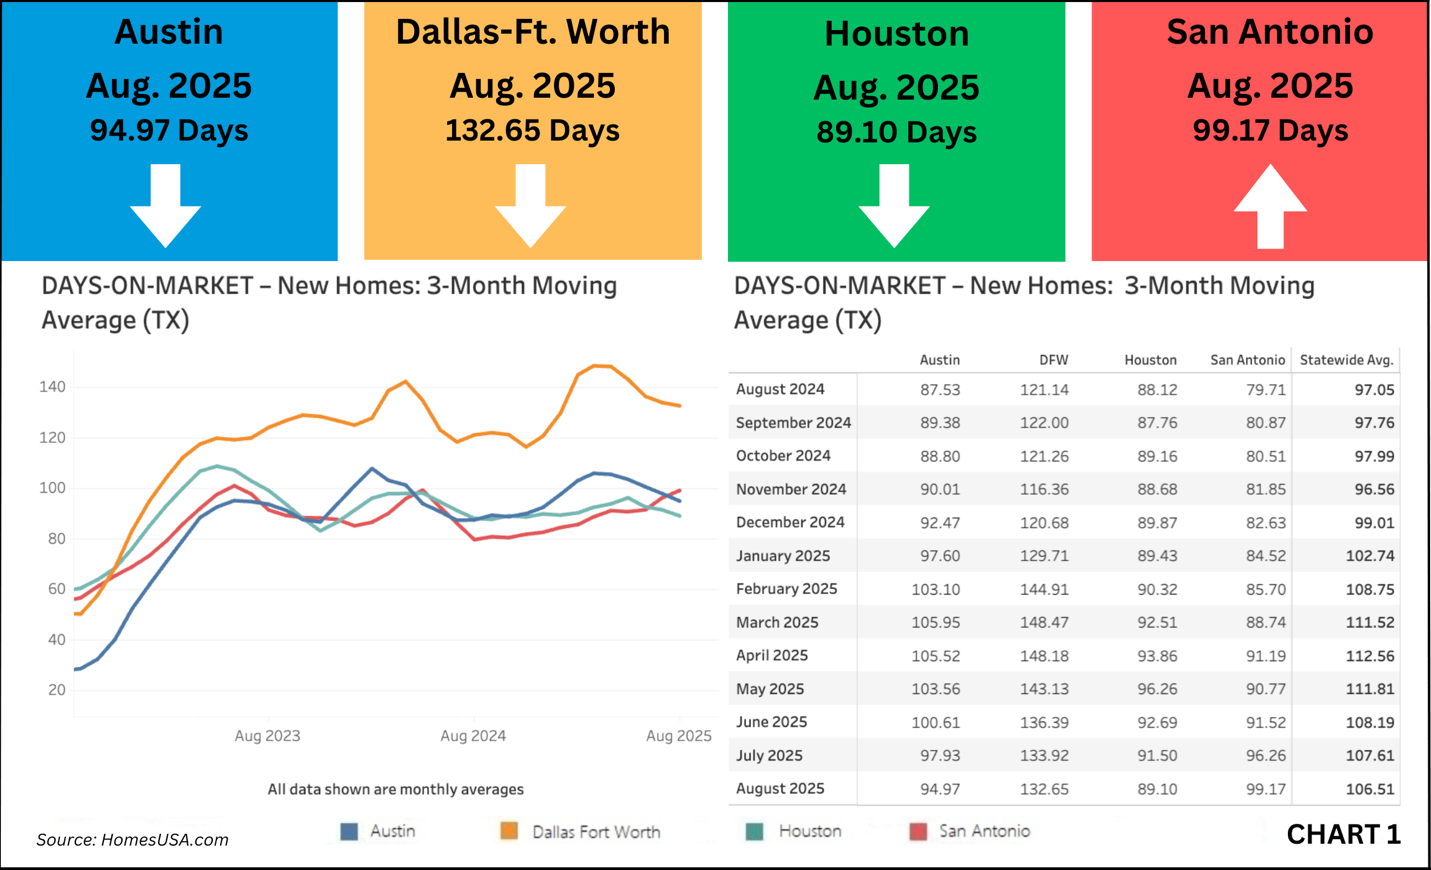
There was a modest improvement in the average pace of new home sales. Houston continued to be the fastest-selling major market with a DOM of 89.10 days, down from 91.50. The statewide average of Days on Market fell to 106.51 days in August, down from 107.61 in July.
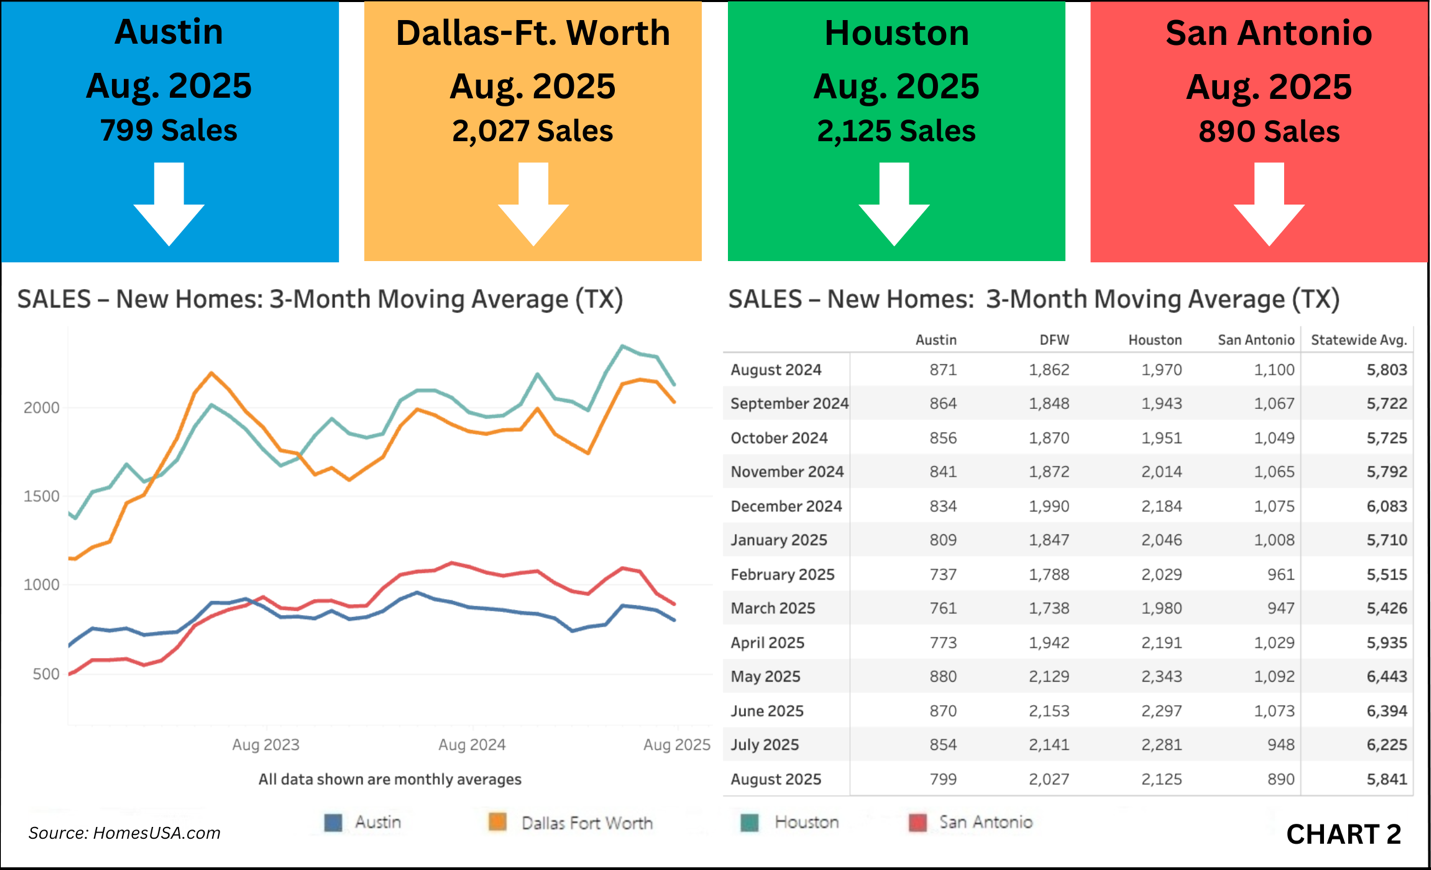
New home sales statewide dropped to 5,841, down from 6,225 in July. Houston led in volume with 2,125 sales, a decrease from 2,281.
“Declining new home sales is not surprising after what we saw this spring,” said Ben Caballero, CEO of HomesUSA.com. “Texas builders continue to build one of the largest inventory benches we’ve seen in years. They’re prepared, if rates give them any room, they’ll be ready to put that inventory to work.”
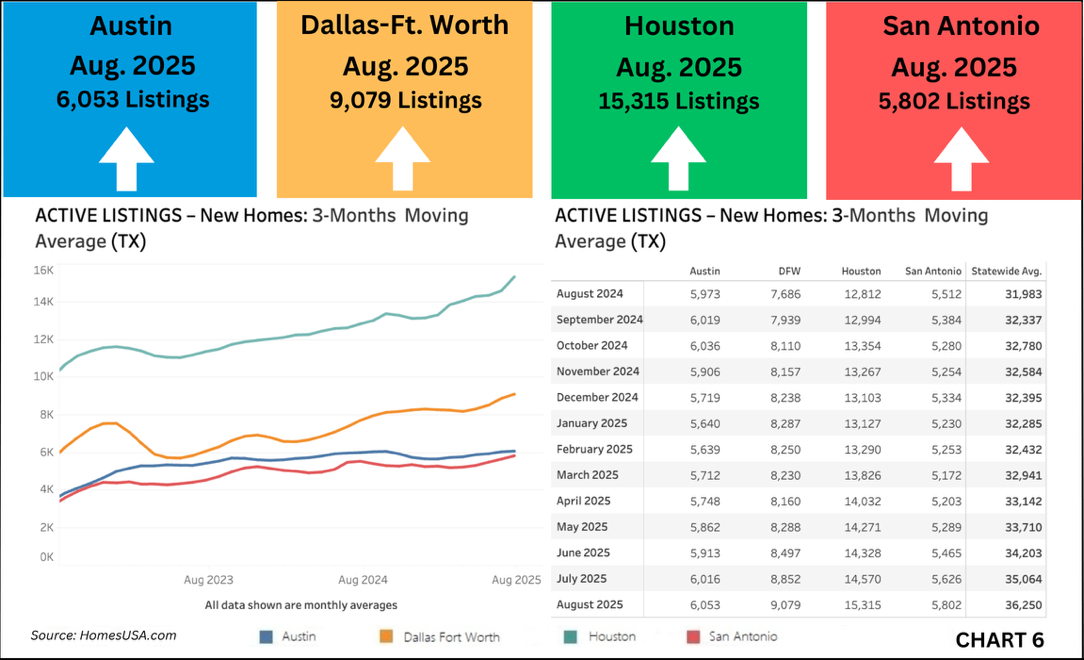
Texas’ new home inventory continues to grow. Active listings statewide climbed to 36,250 in August, up from 35,064 in July. It marked the second consecutive month at a record high since HomesUSA.com began tracking the data in December 2017. Houston led all markets with 15,315 listings, rising from 14,570.
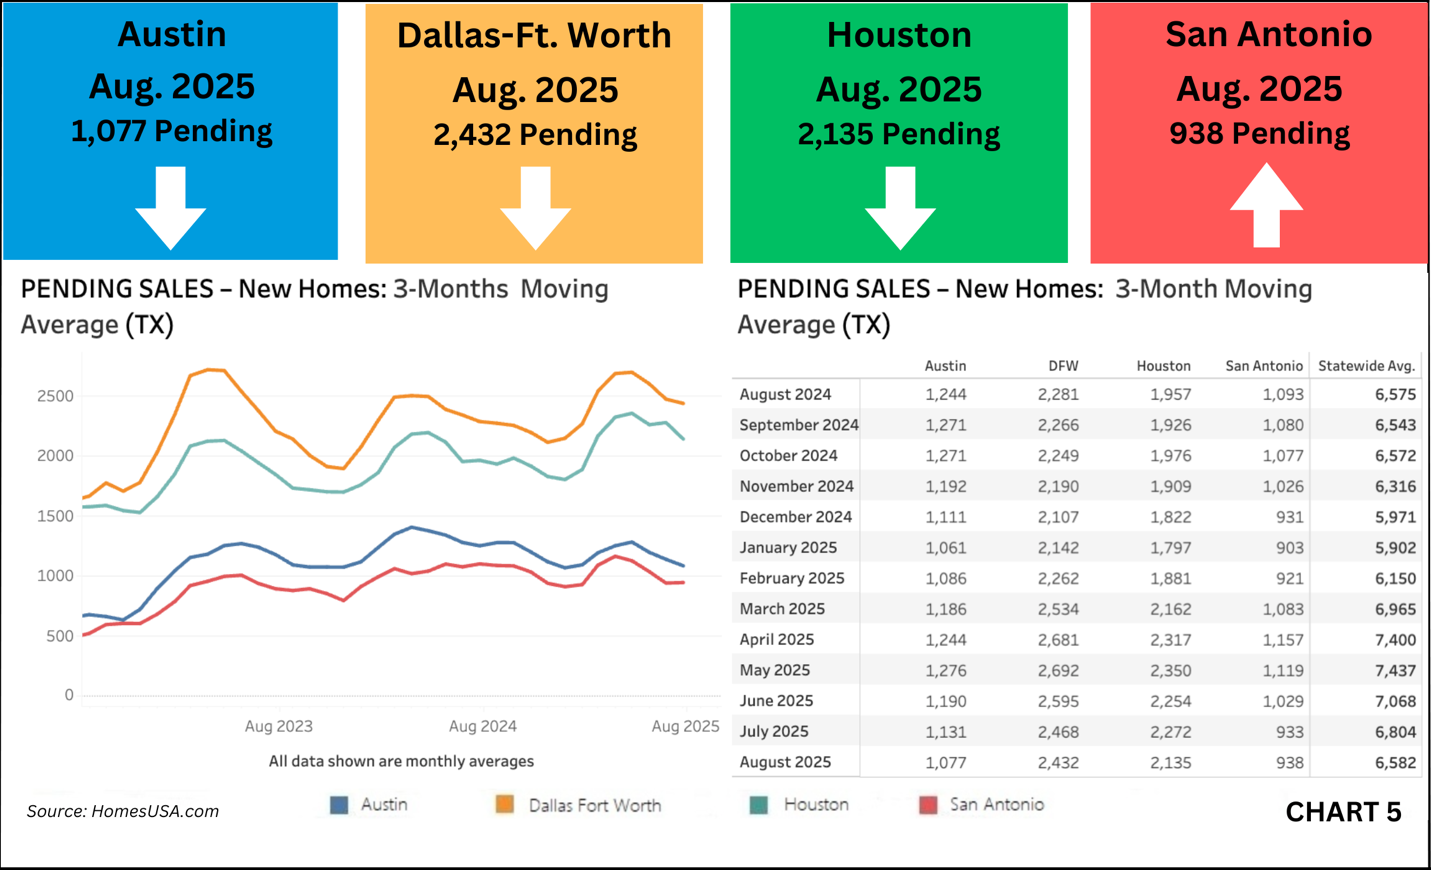
Pending new home sales also fell, signaling continued softness in contract activity. The statewide average dropped to 6,582 in August from 6,804 the previous month.
The average price of a new home was higher in all four major Texas markets at $428,826, up from $425,826 in July.

HomesUSA.com is sharing its Texas New Home Sales Report and New Home Sales Index at the same time the Commerce Department releases its nationwide New Residential Sales Report for August, set for Wednesday, September 24, 2025, at 10:00 am Eastern time.
About the Report
The HomesUSA.com monthly report covers closed sales recorded in MLSs by the 10th day of the following month. The report features 3-month moving averages for six essential market data points, including DOM, sales volume, sales prices, sales-to-list price ratio, pending sales, and active listings. We also provide a master chart for the 12-month moving averages for comparison. Caballero explains the 3-month moving average indices track market seasonality, while the 12-month moving average removes seasonality and tracks the longer trend.
Days on Market Improves – New Homes in Texas (Exclusive Data)
The HomesUSA.com New Home Sales Index showed that the pace of new home sales improved in August, as the average number of Days on Market declined statewide. Texas’ average Days on Market for new homes improved slightly in August, falling to 106.51 days from 107.61 in July, based on the 3-month moving average.
Among the state’s four major new home markets, Houston remained the fastest-selling major market with a DOM of 89.10 days, improving from 91.50 the previous month. Austin saw a faster sales pace, as its DOM dropped to 94.97 days, down from 97.93. In Dallas-Fort Worth, the average DOM also improved, falling to 132.65 days from 133.92. San Antonio was the only major market to slow its pace, with a DOM of 99.17 days from 96.26. Year-over-year, the statewide DOM remains elevated compared to 97.05 days in August 2024.
Note: New homes typically spend more time on the market than existing homes because many are listed while still under construction. Each MLS may calculate DOM differently, so direct comparisons may not always be reliable. (See Chart 1: Texas New Homes Days on Market)
Texas New Home Sales Decline
Texas new home sales declined in August for the third consecutive month. The 3-month moving average of new home sales across the state fell to 5,841, down from 6,225 in July. Houston led all markets and posted the largest monthly decline with 2,125 sales, a decrease from 2,281 the previous month. Dallas-Fort Worth reported 2,027 sales, down from 2,141 in July. Austin sales dropped to 799, compared to 854 in July. San Antonio sales also fell to 890, compared to 948 in July. (See Chart 2: Texas New Home Sales)
Texas New Home Prices Increase
Texas’s average new home prices increased in August. The statewide 3-month moving average edged up to $428,826 from $425,204 in July. Austin posted the highest average price and saw the largest increase at $500,715, up from $489,692. San Antonio prices rose to $359,588 from $355,262. Houston prices edged up to $402,285 from $400,906 as did Dallas-Fort Worth to $459,758 from $457,305. (See Chart 3: Texas New Home Prices)
Texas Sales-to-List Price Ratio Eases
The statewide sales-to-list price ratio for new homes declined slightly in August. The 3-month moving average dropped to 96.87 percent, down from 97.20 percent in July. Dallas-Fort Worth posted a ratio of 97.75 percent versus 97.83 percent in July, a third consecutive monthly decline. Austin recorded 97.45 percent versus 97.76 percent in July, also down for the third month in a row. Houston’s ratio fell to 95.87 percent versus 96.08 percent in July, its third straight monthly drop as well. San Antonio’s average dropped to 96.92 percent versus 97.98 percent, declining for the sixth month in a row after peaking at 98.83 percent in February. (See Chart 4: Texas Sales-to-List Price Ratio)

Texas Pending New Home Sales Decline
Pending new home sales in Texas declined in three of its four major markets in August, suggesting a potential softening in future closings. The 3-month moving average statewide dropped to 6,582, down from 6,804 in July. Dallas-Fort Worth reported 2,432 pending sales, a decrease from 2,468 the previous month. Houston also declined, falling to 2,135 from 2,272 in July while Austin dropped to 1,077, down from 1,131 in July. San Antonio was the only major market to post a monthly increase, rising slightly to 938 from 933 in July. Compared to August 2024’s total of 6,575, statewide pending sales were relatively flat year-over-year. (See Chart 5: Texas Pending New Home Sales)
Texas Active Listings for New Homes Reach Record High
Active new home listings statewide climbed to 36,250 in August, up from 35,064 in July. For the second straight month, it was the highest total of active listings since HomesUSA.com began tracking monthly data in December 2017. Houston led all markets and saw the largest month-over-month gain with 15,315 listings, rising from 14,570. Dallas-Fort Worth active listings increased to 9,079 from 8,852. Austin’s inventory grew to 6,053 from 6,016, and San Antonio’s inventory also rose to 5,802 from 5,626. Statewide inventory was up over 13 percent year-over-year. (See Chart 6: Texas Active Listings)
About the HomesUSA.com New Home Sales Index
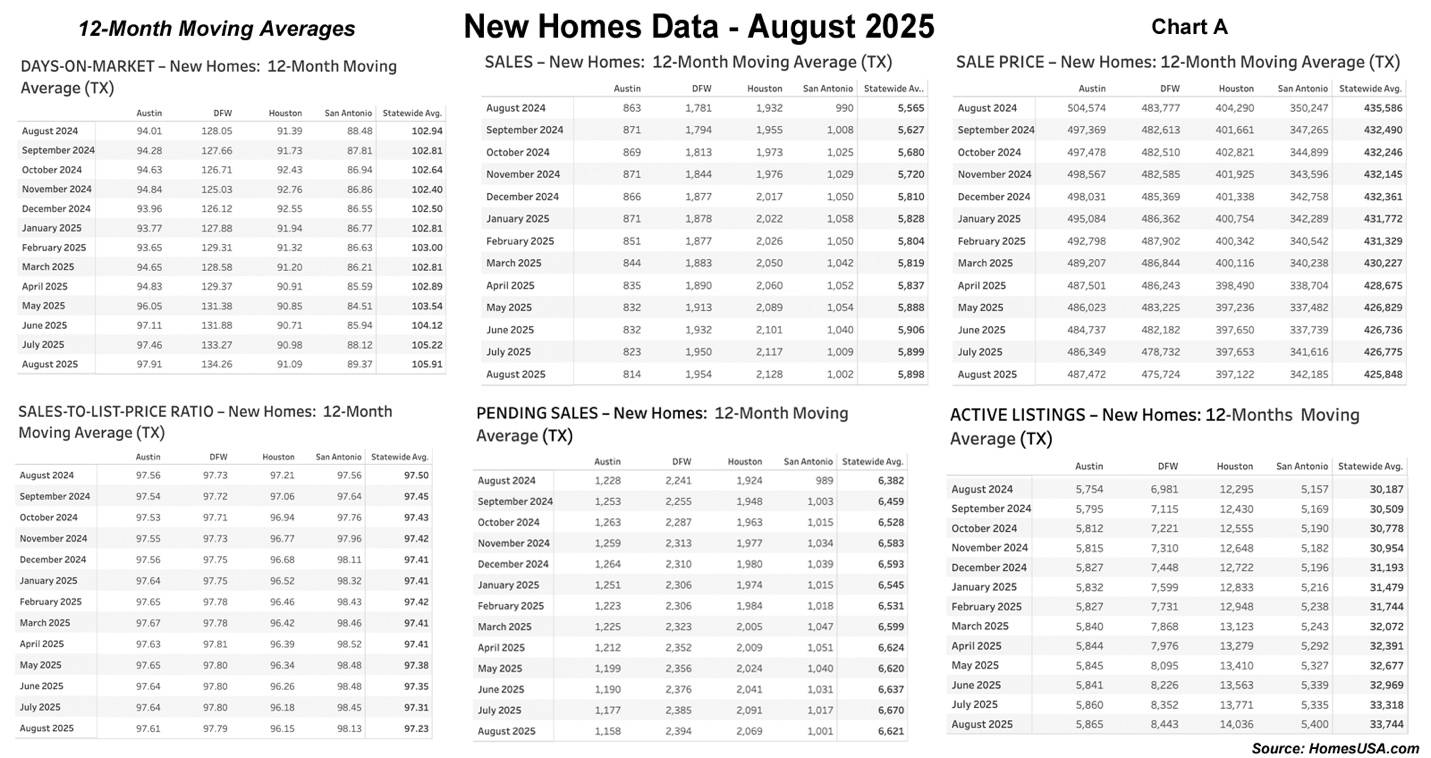
The HomesUSA.com New Home Sales Index is reported as both a 3-month and 12-month moving average of the Days on Market for new homes listed in the local Multiple Listing Services (MLSs) for Dallas-Ft. Worth, Houston, Austin, and San Antonio. Created by Ben Caballero in December 2017, it is the first Days on Market index to track the Texas new home market based on activity in its largest markets and includes homes listed while under construction. (See Chart A: 12-Month Moving Averages)
About Ben Caballero and HomesUSA.com®
Ben Caballero, founder and CEO of HomesUSA.com, is a three-time Guinness World Records title holder for “Most annual home sale transactions through MLS by an individual sell-side real estate agent – current.” Ranked by REAL Trends as America’s top real estate agent for home sales since 2013, Ben is the most productive real estate agent in U.S. history.
He is the only individual real estate agent to reach nearly $4 billion in residential sales transactions in a single year ($3.93 billion in 2024), the first agent to exceed $3 billion (2022), the first to exceed $2 billion (2018–2020), and the first to exceed $1 billion (2015–2017). An award-winning innovator and technology pioneer, Ben works with more than 60 home builders in Dallas-Fort Worth, Houston, Austin, and San Antonio. Ben’s podcast series is available widely, including iTunes, Spotify, and YouTube. Learn more at HomesUSA.com | Twitter: @bcaballero - @HomesUSA | Facebook: /HomesUSAdotcom.
Note for journalists: You may contact Ben Caballero directly by email at ben@homesusa.com.
REALTOR® is a federally registered collective membership mark which identifies a real estate professional who is a member of the NATIONAL ASSOCIATION OF REALTORS® and subscribes to its strict Code of Ethics.
Media Contact:
Kevin Hawkins
(206) 866-1220
kevin@wavgroup.com
Image: Ben Caballero
https://bit.ly/ben-caballero-photo
Individual Chart images:
Chart 1: Days on Market – Thru August 2025: https://homesusa.com/wp-content/uploads/2025/09/Chart-1-Texas-New-Homes-Tracking-Days-on-Market.png
Chart 2: New Home Sales – Thru August 2025: https://homesusa.com/wp-content/uploads/2025/09/Chart-2-Texas-New-Home-Sales-Market.png
Chart 3: Sales Prices – Thru August 2025: https://homesusa.com/wp-content/uploads/2025/09/Chart-3-Texas-New-Home-Sales-Prices-Market.png
Chart 4: Sales-to-List-Price Ratio – Thru August 2025: https://homesusa.com/wp-content/uploads/2025/09/Chart-4-Texas-Sales-to-List-Price-Ratio-Market.png
Chart 5: Pending New Home Sales – Thru August 2025: https://homesusa.com/wp-content/uploads/2025/09/Chart-5-Texas-Pending-New-Home-Sales-Market.png
Chart 6: Active Listings – Thru August 2025: https://homesusa.com/wp-content/uploads/2025/09/Chart-6-Texas-Active-Listings-for-New-Homes-Market.png
Chart A: 12-Month Moving Averages – Thru August 2025: https://homesusa.com/wp-content/uploads/2025/09/Chart-A-12MonthChart-DataOnly.jpg

![]()
Ben Caballero

Ben Caballero is Founder and CEO of HomesUSA.com
Chart 1: DAYS-ON-MARKET – New Homes: 3-Month Moving Average (TX)

DAYS-ON-MARKET – New Homes: 3-Month Moving Average (TX)
Chart 2: SALES – New Homes: 3-Month Moving Average (TX)
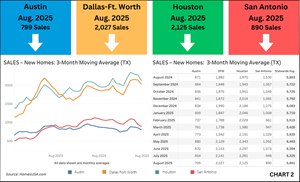
SALES – New Homes: 3-Month Moving Average (TX)
Chart 6: ACTIVE LISTINGS – New Homes: 3-Months Moving Average (TX)
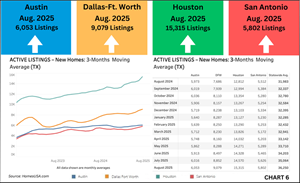
ACTIVE LISTINGS – New Homes: 3-Months Moving Average (TX)
Chart 5: PENDING SALES – New Homes: 3-Month Moving Average (TX)
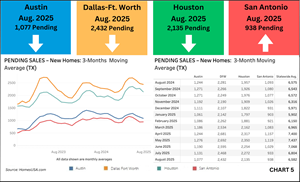
PENDING SALES – New Homes: 3-Month Moving Average (TX)
Chart 3: SALE PRICE – New Homes: 3-Month Moving Average (TX)
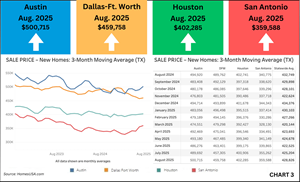
SALE PRICE – New Homes: 3-Month Moving Average (TX)
Chart 4: SALES-TO-LIST-PRICE-RATIO – New Homes: 3-Month Moving Average (TX)
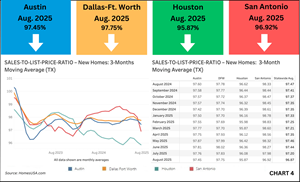
SALES-TO-LIST-PRICE-RATIO – New Homes: 3-Month Moving Average (TX)
Chart A: 12-Month Moving Averages

12-Month Moving Averages
Legal Disclaimer:
EIN Presswire provides this news content "as is" without warranty of any kind. We do not accept any responsibility or liability for the accuracy, content, images, videos, licenses, completeness, legality, or reliability of the information contained in this article. If you have any complaints or copyright issues related to this article, kindly contact the author above.
